Pertrigonometric functions are modifications of the three primary trigonometric functions. Unlike the familiar sine, cosine, and tangent functions, the “pertrig” functions include triangle perimeter in their right-triangle-based definitions, which are given in the bulleted list below. The longer form of “pertrigonometric functions” is “perimeter-based trigonometric functions,” and the shorter, informal version is “pertrig functions.”
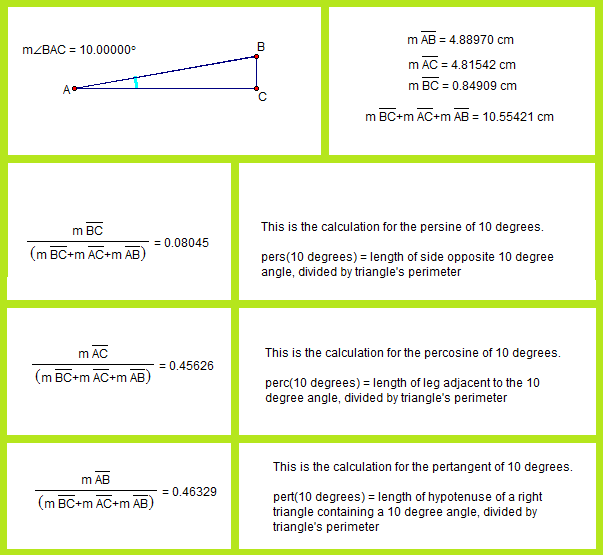
- The persine of an acute angle (abbreviated “pers”) equals the length of the side opposite that angle, in a right triangle, divided by the triangle’s perimeter.
- The percosine of an acute angle (abbreviated “perc”) equals the length of the leg adjacent to that angle, in a right triangle, divided by the triangle’s perimeter.
- The pertangent of an acute angle (abbreviated “pert”) equals the length of the hypotenuse of a right triangle containing this acute angle, divided by the triangle’s perimeter.
After defining these terms, I used Geometer’s Sketchpad to construct a right triangle containing a 10º angle, and then used the “measure” and “calculate” functions to find the values of pers(10º), perc(10º), and pert(10º). Since these are ratios, they would have the same values shown for larger or smaller right triangles which contain 10º angles.

An observation: the pertangents of complementary angles are equal. Why? Because complementary angles appear in all right triangles, as pairs of acute angles in the same triangle. For each such complementary angle pair, therefore, the same triangle is used to define pertangent. The hypotenuse/perimeter ratio (which is pertangent) would, it follows, remain unchanged — because both its numerator and denominator remain unchanged. This relationship does not hold for the tangent function; instead, the tangents of complementary acute angles are reciprocals of each other.
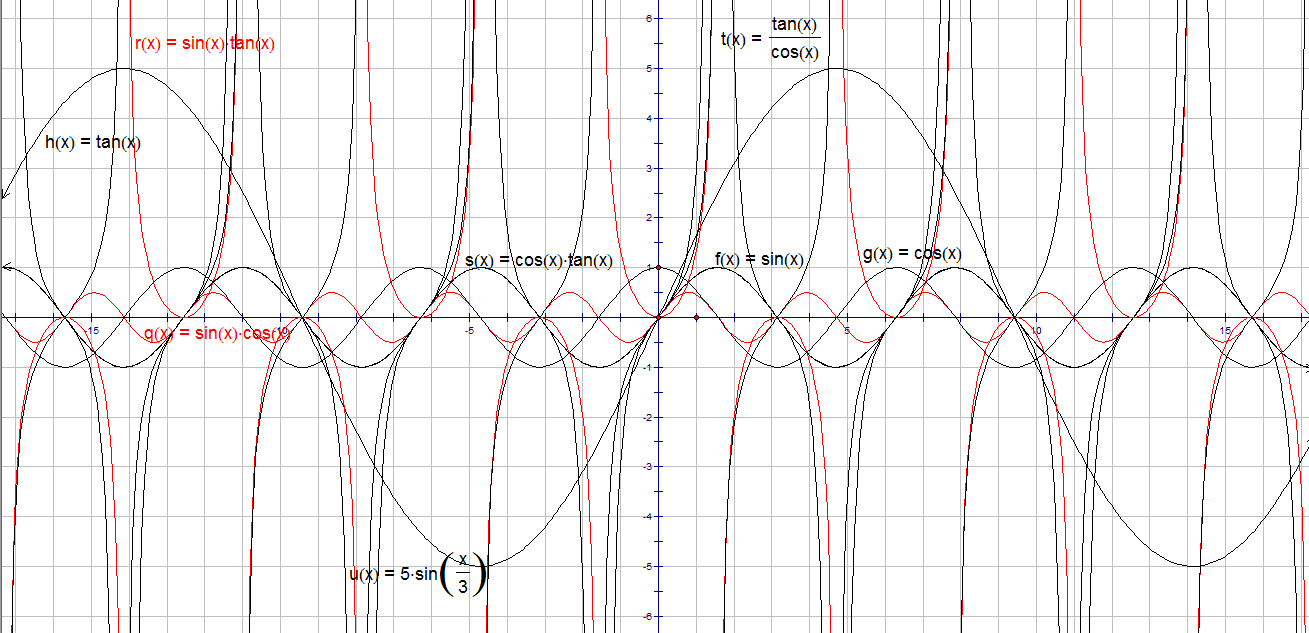
Of course, I wanted to know more than just the pers, perc, and pert values for 10º, but I had no desire to repeat the same calculations, many more times, to form a table. Instead, I simply graphed the functions, again using Geometer’s Sketchpad. The units on the x-axis are degrees, not radians.

In the graph above, the dark blue curve is the persine function, with the sine function in light blue, for comparison. Similarly, percosine is shown in red, with cosine shown in pink. Finally, pertangent is shown with a heavy, dark green curve, while tangent is shown as a thinner, light green curve.
Entering the equations for these curves was a little tricky, due to the fact that I wanted this graph to venture beyond 0 and 90 degrees, in both directions, on the x-axis. When that is done, the unit circle must be used (in place of right-triangle based definitions), simply because no right triangles contain angles outside this range. The radius of the unit circle is 1, by definition, and that is the hypotenuse of the right triangle which exists in the zero-to-ninety degree part of the domain of the graph above. As a consequence of setting the length of the hypotenuse of each right triangle at 1, the side opposite the angle in question (used for persine) becomes, simply, the sine of that angle, while the adjacent leg’s length is the angle’s cosine. It then follows that the perimeter (the denominator of the pers, perc, and pert ratios) is equal to sin(x) + cos(x) + 1.
Calculations are shown on the graph above, and you can click on the graph to enlarge it, to make them more readable. In these calculations, one more adjustment had to be made, and that was to the perimeter portion of each pertrigonometric ratio. Using sin(x) + cos(x) + 1 works fine for perimeter, for the zero-to-ninety degree portion of the domain, but, outside that, negative numbers intrude, for values of sin(x) and/or cos(x). It is my contention that triangle perimeter only makes sense as a sum of absolute values of a triangle’s three side lengths. To obtain absolute values for both sin(x) and cos(x) in the perimeter-part of each calculation, then, I simply squared each of these two functions, and then took the square roots of those squares. The result of this can be seen on the graph, in the curve for the pertangent function, which resembles a child’s drawing of waves in the ocean. On the y-axis, it never reaches as low as 0.4, and its maximum value is clearly exactly 0.5 — at the sharp “wave peaks.” At the (smooth) troughs, the actual minimum is equal to the square root of two, minus one, or ~0.414, although I have not yet figured out exactly why that is the case — I simply noticed it on the graph — but, to investigate it further, I know where to look: the 45-45-90 triangle, since these minima are hit when x = (45 ± 90n) degrees, where n is any integer. The pertangent function has the shortest period of all the functions shown above, at a mere 90º. For tangent, by contrast, the period is 180º. All four of the other functions shown have periods of a full 360º.
It is striking that the pertangent and tangent curves bear little resemblance to each other, while marked resemblances do exist between the persine and sine curves, as well as between the percosine and cosine curves. In informal terms, the persine curve is a shorter and spikier (but still recognizable) version of the sine curve (vertically, with the amplitude exactly one-half as great for the shorter persine curve, relative to the sine curve), but, horizontally, the two curves are synchronized. The same relationship holds for the percosine and cosine curves. Also, it is well-known that the cosine curve is simply the sine curve, phase-shifted one-quarter cycle (or 90º, or π/2 radians) to the left. This phase-shift relationship between the cosine and sine curves holds, precisely, for the percosine and persine curves.
There is a simple reason why persine, percosine, and pertangent all peak at exactly y = ½. All three functions generalize, for acute angles, to this ratio — (some side of a right triangle)/(perimeter of that same triangle) — and no side of any triangle can ever exceed, nor even reach, half that same triangle’s perimeter. In all three cases, the maximum y-value is only reached, even in the zero-to-ninety degree portion of the domain, for “degenerate cases” — angles of 0º or 90º, which are, of course, not acute angles at all. Interpreted as triangles, these are cases where either a triangle becomes so short that it collapses to a single segment, or the opposite degenerate situation: two parallel lines, connected by a single segment. If you try to make either (or both) of the acute angles in a right triangle into an additional right angle, after all, that’s what you get.
To my knowledge, no one has described these pertrigonometric functions before, by this or any other name, although I could be wrong. (If I am wrong on this point, please let me know in a comment.) Regardless of whether this is their first appearance, or not, I did not invent them. The reason for this is simple: nothing in mathematics is ever “invented” — only discovered — for mathematics existed long before human beings existed, let alone started writing things down. How do I know this? Simple: there was a universe here before there were people, and all evidence indicates that it operated under the same laws of physics we observe today — and all evidence to date also indicates that those laws are mathematical in nature. Therefore, with the “pertrig” functions, I either discovered them, or, if they have been found before, then I independently rediscovered them.
Finally, I’ll address that question so often asked, about numerous things, in mathematics classes: what are these pertrigonometric functions used for? As far as I know, the answer in this case, so far, is absolutely nothing, other than delighting me by their very existence. It is possible that this may change, for someone might find a way to make a profitable application of these functions — and I won’t get any money if they do, either, for I am not copyrighting any of this. Nothing in mathematics is subject to ownership.
Honestly, though, I hope no one ever finds any practical, “real-world” use, at all, for pers, perc, or pert. Right now, they are pure mathematical ideas, unsullied by tawdry, real-world applications, and, well, I like that. I am far from the only person who ever had such an attitude about a mathematical idea, either — such views are actually fairly common in the mathematical community. Most of those who try to discover previously-unseen things in mathematics do so solely, or primarily, for one reason: the joy of discovery, in its purest form.