The sine and cosine curves themselves are shown for reference, and all four possible combinations of sine and/or cosine which nest one function inside another (with values for the outer function to evaluate ranging from -2π to 2π) are also shown.

The sine and cosine curves themselves are shown for reference, and all four possible combinations of sine and/or cosine which nest one function inside another (with values for the outer function to evaluate ranging from -2π to 2π) are also shown.
As if the world needed another trigonometric function, I give it the WM function, named after the letters apparent in its graph. It is the sine of the sine of x, times 2π, if x is measured in radians, as in the graph below.


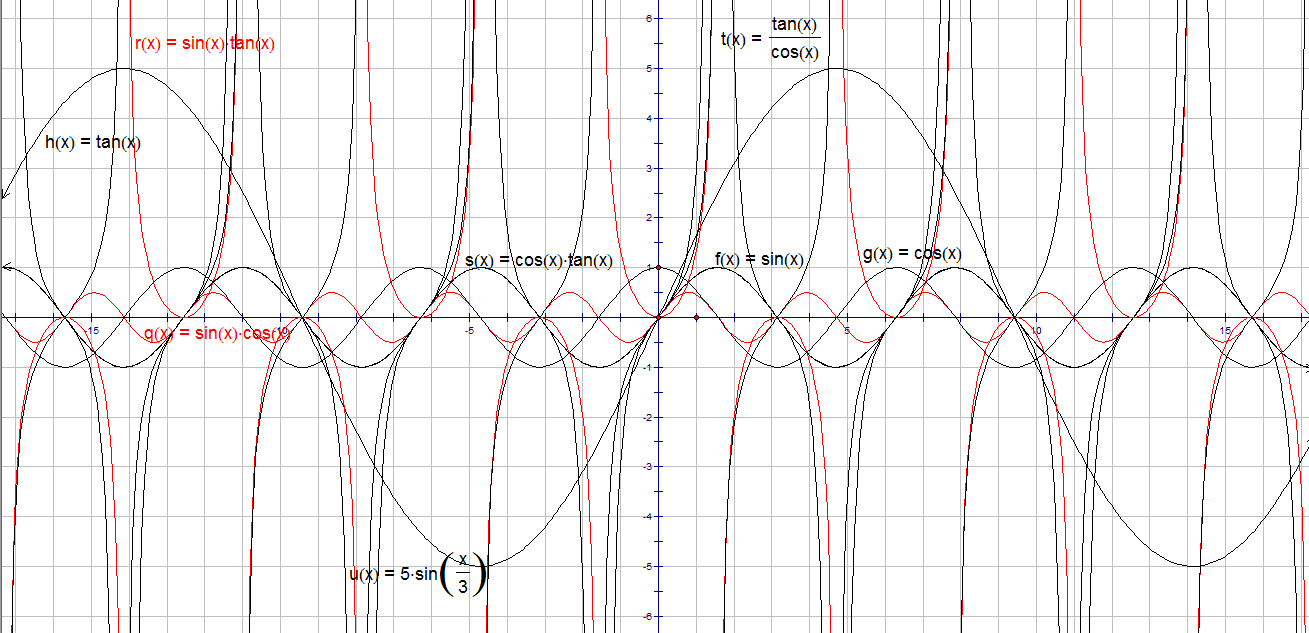
To make the virtual “painting” above, I plotted simple and moderately-complex trigonometric functions on a single coordinate plane, as shown below, using Geometer’s Sketchpad. I then erased all the text, etc., copied-and-pasted a screenshot into MS-Paint, and used that program to make the finished image above.

A few minutes ago, I wondered how to write a function whose graph would be a sine curve, but one that undulated above and below the diagonal line y=x, rather than the x-axis, as is usually the case. How to accomplish such a 45 degree counterclockwise rotation?
Well, first, I abandoned degrees, set Geometer’s Sketchpad to radians, and then simply constructed plots for both y = x and y = sin(x). Next, I added them together. The result is the green curve (and equation) you see above.
This only half-solves the problem. Does it undulate above and below y=x? Yes, it does. However, if you rotate this whole thing, clockwise, one-eighth of a complete turn, so that you are looking at the green curve going along the x-axis, you’ll notice that it is not a true sine curve, but a distorted one. Why? Because it was generated by adding y-values along the original x-axis, not by a true rotation.
I’m not certain how to correct for this distortion, or otherwise solve the problem. If anyone has a suggestion, please leave it in a comment. [Note: an astute follower of this blog has now done exactly that, so I refer the reader to the comments for the rest of the story here.]

The last post made me curious about other trigonometric functions’ graphs, in a polar coordinate system. They were not what I expected. Here they are.

When y=sin(x) is plotted on a polar coordinate system, with everything set, consistently, to radians, the resulting graph is a circle sitting atop the origin, with unit diameter.
